


In technical analysis, support and resistance is a concept that the movement of the price of a security will tend to stop and reverse at certain predetermined price levels. These levels are denoted by multiple touches of price without a breakthrough of the level.
Support versus resistance
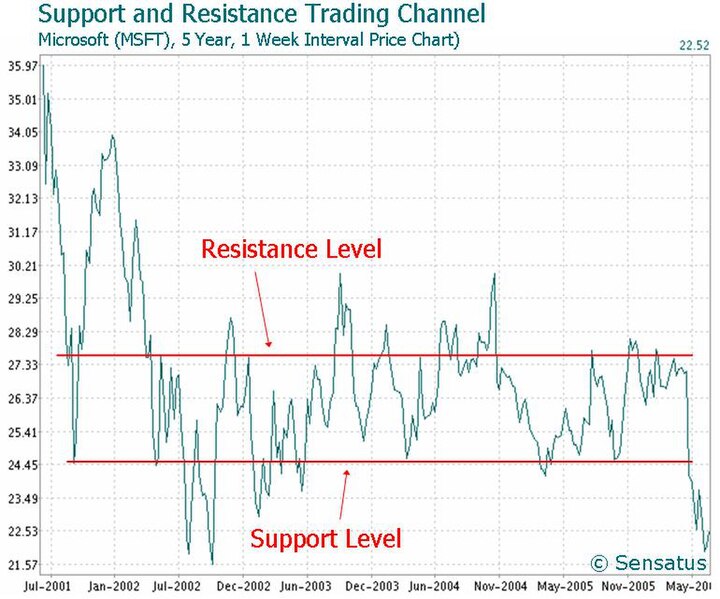
A support level is a level where the price tends to find
support as it falls. This means the price is more likely to "bounce"
off this level rather than break through it. However, once the price has
breached this level, by an amount exceeding some noise, it is likely to
continue falling until meeting another support level.
A resistance level is the opposite of a support level. It is where the price tends to find resistance as it rises. This means the price is more likely to "bounce" off this level rather than break through it. However, once the price has breached this level, by an amount exceeding some noise, it is likely to continue rising until meeting another resistance level.
Reactive vs Proactive support and resistance

Proactive support and resistance methods are 'predictive' in
that they often outline areas where price has not actually been.
They are based upon current price action that through
analysis has been shown to be predictive of future price action. Proactive
support and resistance methods include Measured Moves, Swing Ratio
Projection/Confluence (Static (Square of Nine), Dynamic (Fibonacci)),
Calculated Pivots, Volatility Based, Trendlines and Moving averages, VWAP,
Market Profile (VAH, VAL and POC).
Reactive support and resistance are the opposite: they are
formed directly as a result of price action or volume behaviour. They include
Volume Profile, Price Swing lows/highs, Initial Balance, Open Gaps, certain
Candle Patterns (e.g. Engulfing, Tweezers) and OHLC.
A price histogram is useful in showing at what price a
market has spent more relative time. Psychological levels near round numbers
often serve as support and resistance.
Identifying support and resistance levels
Support and resistance levels can be identified by trend
lines (technical analysis).[4] Some traders believe in using pivot point
calculations.
The more often a support/resistance level is
"tested" (touched and bounced off by price), the more significance
given to that specific level.
If a price breaks past a support level, that support level
often becomes a new resistance level. The opposite is true as well, if price
breaks a resistance level, it will often find support at that level in the future.
Psychological Support and Resistance levels form an
important part of a trader's technical analysis. As price reaches a value
ending in 50 (ex. 1.2050) or 00 (ex. 1.3000), humans often see these levels as
a strong potential for interruption in the current movement. The price may hit
the line and reverse, it could hover around the level as Bulls and Bears fought
for supremacy, or it may punch straight through. A trader should always
exercise caution when approaching 00 levels in general and 50 levels if it has
previously acted as Support or Resistance.

Using support and resistance levels
This is an example of support switching roles with resistance, and vice versa:

When judging entry and exit investment timing using support
or resistance levels it is important to choose a chart based on a price
interval period that aligns with your trading strategy timeframe. Short term
traders tend to use charts based on interval periods, such as 1 minute (i.e.
the price of the security is plotted on the chart every 1 minute), with longer
term traders using price charts based on hourly, daily, weekly or monthly
interval periods. Typically traders use shorter term interval charts when
making a final decisions on when to invest, such as the following example based
on 1 week of historical data with price plotted every 15 minutes. In this
example the early signs that the stock was coming out of a downtrend was when
it started to form support at $30.48 and then started to form higher highs and
higher lows signalling a change from negative to positive trending.
Source : [1]

Hello, Admin!
BalasPadamI am Agung, from Instaforex Partner-Relation Department.
I am inviting you to a partnership program with commission 15-53 USD. This partnership program is free.
In addition, we also provide various trading instruments, such as forex, stocks, golds, bitcoin, CFD, and options.
If you are interested or you want to know more about this partnership, feel free to contact me through these contacts below.
Regards,
Agung
agung@mail4.instaforex.com
Skype: live:19058306552bbbfd
Facebook: agung.ifxteam
WhatsApp: 628119104920
partners.instaforex.com